Advertisements
Advertisements
Question
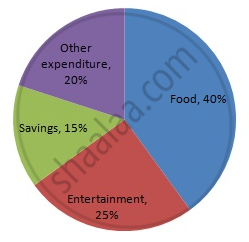
The following table shows how a student spends his pocket money during the course of a month. Represent it by a pie-diagram.
| Items | Food | Entertainment | Other expenditure | Savings |
| Expenditure | 40% | 25% | 20% | 15% |
Advertisements
Solution
We know:
Central angle of a component = (component value/sum of component values x 360)
Here, total expenditure = 100%
Thus, central angle for each component can be calculated as follows:
| Item | Expenditure (in %) |
Sector angles |
| Food | 40 | 40/100 x 360 = 144 |
| Entertainment | 25 | 25/100 x 360 = 90 |
| Other expenditures | 20 | 20/100 x 360 = 72 |
| Savings | 15 | 15/100 x 360 = 54 |
Now, the pie chat representing the given data can be constructed by following the steps below:
Step 1 : Draw circle of an appropriate radius.
Step 2 : Draw a vertical radius of the circle drawn in step 1.
Step 3 : Choose the largest central angle. Here the largest central angle is 144o. Draw a sector with the central angle 144o in such a way that one of its radii coincides with the radius drawn in step 2 and another radius is in its counter clockwise direction.
Step 4 : Construct other sectors representing the other items in the clockwise sense in descending order of magnitudes of their central angles.
Step 5 : Shade the sectors with different colours and label them, as shown as in figure below.