Advertisements
Advertisements
Question
The following table gives the production yield per hectare of wheat of 100 farms of a village.
| Production yield (kg/ha) |
50 – 55 |
55 – 60 |
60 – 65 |
65 – 70 |
70 – 75 |
75 – 80 |
| Number of farms |
2 | 8 | 12 | 24 | 238 | 16 |
Change the distribution to a ‘more than type’ distribution and draw its ogive. Using ogive, find the median of the given data.
Graph
Sum
Advertisements
Solution
The frequency distribution table of more than type is as follows:
| Production yield (kg/ha) (lower class limits) | Cumulative frequency (cf) |
| More than 50 | 2 + 98 = 100 |
| More than 55 | 8 + 90 = 98 |
| More than 60 | 12 + 78 = 90 |
| More than 65 | 24 + 54 = 78 |
| More than 70 | 38 + 16 = 54 |
| More than 75 | 16 |
Taking the lower class limits on x-axis and their respective cumulative on y-axis, its ogive can be drawn as follows
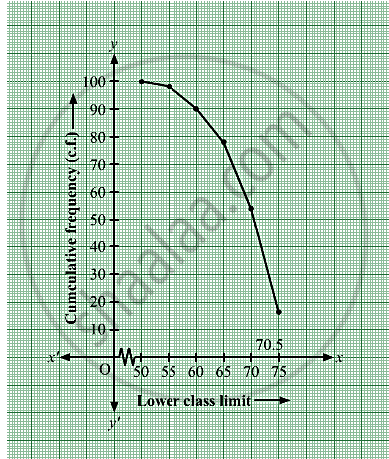
Here, N = 100 ⇒ `N/2 = 50.`
Mark the point A whose ordinate is 50 and its x-coordinate is 70.5.
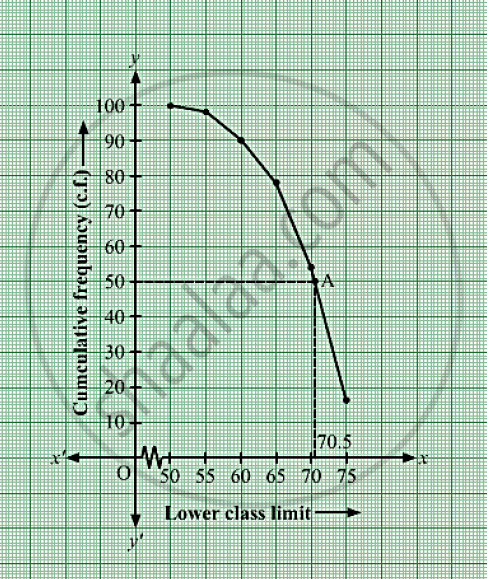
Thus, median of the data is 70.5.
shaalaa.com
Is there an error in this question or solution?
