Advertisements
Advertisements
Question
The following table gives the GVA in Rupees (Crores) by the three sectors:
| Year | Primary | Secondary | Tertiary |
| 2001-02 | 13,23,000 | 10,40,000 | 19,31,000 |
| 2021-22 | 24,79,400 | 40,73,000 | 73,25,000 |
- Calculate the share of the three sectors in GDP for 2000 and 2013.
- Show the data as a bar diagram similar to Graph 2 in the chapter.
- What conclusions can we draw from the bar graph?
Advertisements
Solution
(i)
Fiscal Year 2001-02
Total GDP = 13,23,000 + 10,40,000 + 19,31,000
= 42,94,000 Crores
Primary Share = `(13,23,000)/(42,94,000) xx 100`
= 30.81%
Secondary Share = `(10,40,000)/(42,94,000) xx 100`
= 24.22%
Tertiary Share = `(19,31,000/(42,94,000) × 100`
= 44.97%
Fiscal Year 2021-22
Total GDP = 24,79,400 + 40,73 000 + 73,25,000
= 1,38,77,400 Crores
Primary Share = `(24,79,400)/(1,38,77,400) xx 100`
= 17.87%
Secondary Share = `(40,73,000)/(1,38,77,400) xx 100`
= 29.35%
Tertiary Share = `(73,25,000)/(1,38,77,400) × 100`
= 52.78%
(ii)
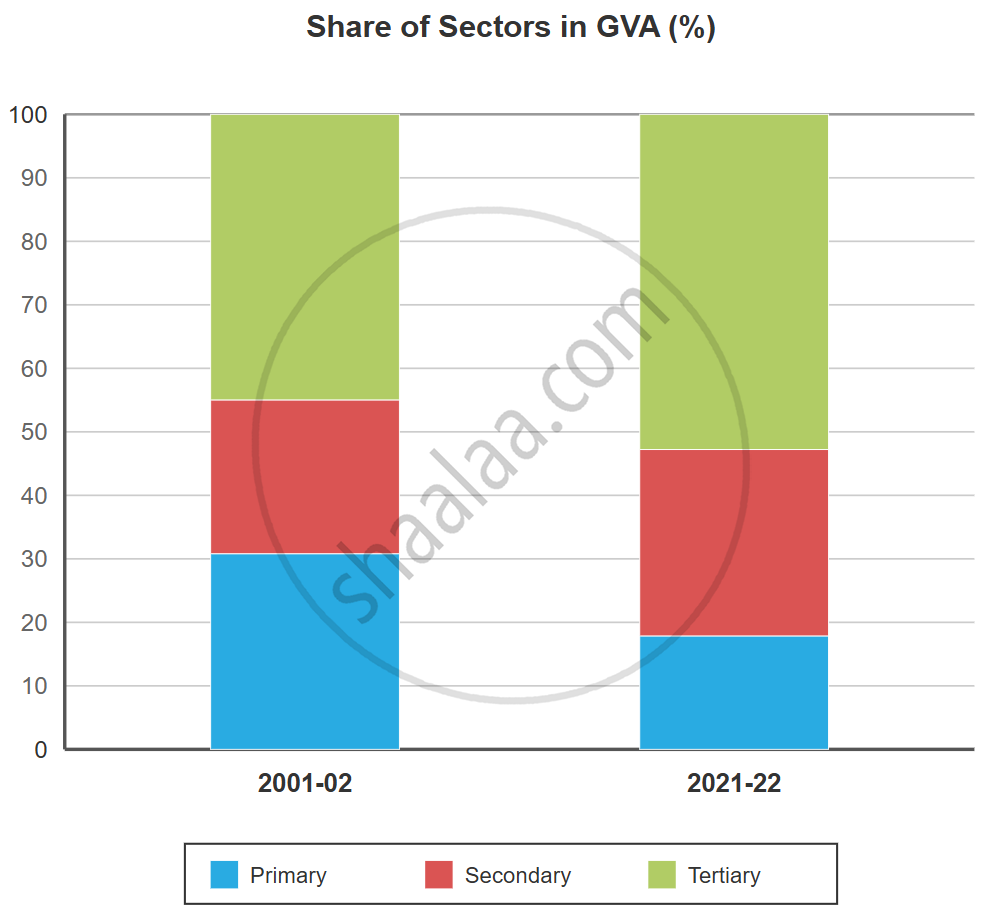
(iii) The bar diagram depicts a significant structural movement in the Indian economy over a two-decade period, demonstrating a characteristic trademark pattern of a developing country transitioning away from primary resource dependence. The most notable shift is the solidified dominance of the tertiary (service) sector, which increased from 44.97% to 52.78%, accounting for more than half of the country’s total economic value output. Simultaneously, the industrial secondary sector expanded significantly, growing from 24.22% to 29.35%, demonstrating strong modernisation and strengthening production capacity. In stark contrast, while the main agricultural sector increased in raw monetary value, its relative macroeconomic share fell sharply, from 30.81% to 17.87%. This demonstrates that, while India’s total economic production has increased tremendously, the engines of growth have firmly switched to the industrial and service sectors.
