Advertisements
Advertisements
Question
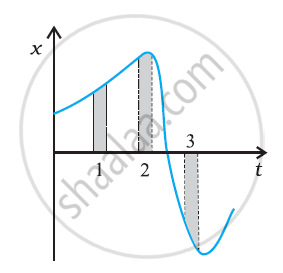
The following figure gives the x-t plot of a particle in one-dimensional motion. Three different equal intervals of time are shown. In which interval is the average speed greatest, and in which is it the least? Give the sign of average velocity for each interval.
Advertisements
Solution
The average speed of a particle depicted in the x-t graph is derived from the graph's slope during a specific time interval. The graph indicates that the slope is at its maximum and minimum in intervals 3 and 2, respectively. Hence, the particle's average speed is highest in interval 3 and lowest in interval 2. The average velocity's sign is positive in intervals 1 and 2, as the slope is positive within these intervals. However, it is negative in interval 3, as the slope is negative there.
