Advertisements
Advertisements
Question
The following bar graph shows the profit (+) and loss (−) of a small scale company (in crores) between the years 2011 to 2017.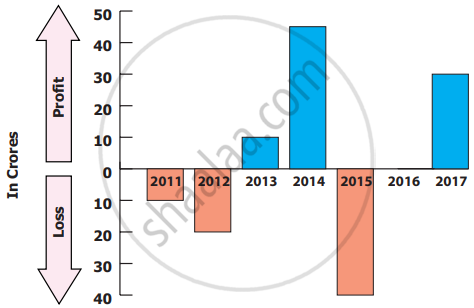
i) Write the integer that represents a profit or a loss for the company in 2014?
ii) Denote by an integer on the profit or loss in 2016.
iii) Denote by integers on the loss for the company in 2011 and 2012.
iv) Say True or False: The loss is minimum in 2012.
v) Fill in: The amount of loss in 2011 is _______ as profit in 2013.
Advertisements
Solution
i) Profit ₹ 45 crores.
∴ + 45
ii) In 2016 neither profit nor loss happened.
∴ 0
iii) In 2011 loss is 10 crores and in 2012 loss is 20 crores.
∴ −10 and −20.
iv) In 2011 the company’s loss is minimum - False
v) The amount of loss in 2011 is the same as profit in 2013.
APPEARS IN
RELATED QUESTIONS
Using a number line, find the integer which is 7 less than -8
From the following number line, identify the correct and the wrong representation with reason
![]()
Mark the following numbers on a number line
All integers which are greater than −7 but less than 7
On the number line, the integer 5 is located ______.
On the number line, 10 is to the ______ of zero.
On the following number line, (–4) × 3 is represented by the point ______.
![]()
Represent the following numbers on a number line:
−10
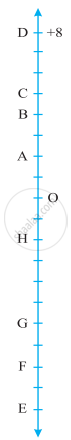
The adjacent figure is a vertical number line, representing integers. Observe it and locate the following points:
Write integers for points B and E.
In the following pairs, which number is to the right of the other on the number line?
–6, 6
In the following pairs, which number is to the right of the other on the number line?
1, –100
