Advertisements
Advertisements
Question
The diagram below shows a cooling curve for a substance X:
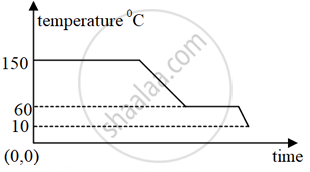
(a) State the temperatures at which the substance condenses.
(b) Mention the temperature range in which the substance is in its liquid state.
(c) State true or false:
The amount of heat released when a substance is cooled by 10°C in its liquid state is greater than the heat released when it is cooled by the same amount in its solid state.
Advertisements
Solution
(a) Substance condenses at 150 °C.
(b) 150 °C to 60 °C.
(c) This statement is true.
Explanation:
The amount of heat released when a substance is cooled depends on :
Q = mcΔT
Where:
Q = Heat released
m = Mass of the substance
c = Specific heat capacity
ΔT = Change in temperature
Now, for the same mass and same temperature drop (10°C), the specific heat capacity (c) of a liquid is usually greater than that of its solid form.
So, `"Q"_"liquid" > "Q"_"solid"`
Hence, more heat is released when cooling a substance by 10°C in its liquid state than in its solid state, due to higher specific heat capacity.
