Advertisements
Advertisements
Question
The daily wages of workers in a construction unit were recorded as follows:
| Class Marks (Wages) | 425 | 275 | 525 | 575 | 625 | 675 |
| No. of workers | 6 | 12 | 15 | 17 | 7 | 13 |
Form a frequency distribution table with class intervals and find modal wage by plotting a histogram.
Advertisements
Solution
Difference between two consecutive class marks = 475 – 425 = 50.
Adjustment factor = `"Class width"/2`
= `50/2`
= 25
Lower class limit = Class mark – Adjustment factor
Upper class limit = Class mark + Adjustment factor
| Class | Frequency |
| 400 – 450 | 6 |
| 450 – 500 | 12 |
| 500 – 550 | 15 |
| 550 – 600 | 17 |
| 600 – 650 | 7 |
| 650 – 700 | 3 |
Steps of construction:
-
Take 2 cm along x-axis = ₹ 50 and 2 cm along y-axis = 5 workers.
-
Construct rectangles corresponding to the given data.
-
In highest rectangle, draw two st. lines AD and BC from corners of the rectangles on either side of the highest rectangle to the opposite corners of the highest rectangle.
-
Let K be the point of intersection of AD and BC. Through K, draw a vertical line to meet the x-axis at L. The abscissa of the point L represents 557.50.
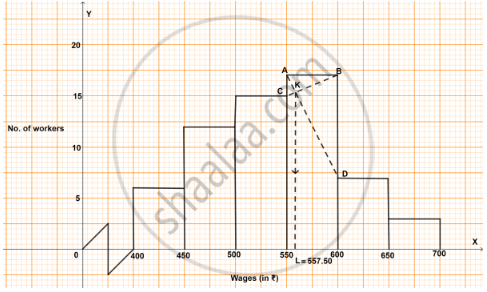
Hence, mode = ₹ 557.50
