Advertisements
Advertisements
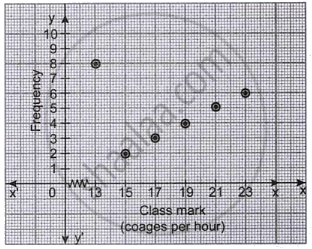
Question
The class mark and frequency of a data is given in the graph. From the graph, Find:
- the table showing the class interval and frequency.
- the mean.
Advertisements
Solution
a. Table showing class interval and frequency
To find the class intervals, we determine the class size (h) by calculating the difference between consecutive class marks:
h = 15 – 13 = 2.
Since the class size is 2, each class interval will extend 1 unit below and 1 unit above its class mark calculated as `x ± h/2`.
| Class Mark (x) | Class Interval | Frequency (f) |
| 13 | 12 – 14 | 8 |
| 15 | 14 – 16 | 2 |
| 17 | 16 – 18 | 3 |
| 19 | 18 – 20 | 4 |
| 21 | 20 – 22 | 5 |
| 23 | 22 – 24 | 6 |
| Total | Σf = 28 |
b. Finding the mean
The mean `(barx)` for grouped data is calculated using the formula:
`barx = (sum(f xx x))/(sumf)`
Step 1: Calculate the product of class marks and frequencies (f × x):
8 × 13 = 104
2 × 15 = 30
3 × 17 = 51
4 × 19 = 76
5 × 21 = 105
6 × 23 = 138
Step 2: Sum the values:
Σ(f × x) = 104 + 30 + 51 + 76 + 105 + 138 = 504
Σf = 8 + 2 + 3 + 4 + 5 + 6 = 28
Step 3: Solve for mean:
`barx = 504/28`
`barx` = 18
