Advertisements
Advertisements
Question
The alternating current I in an inductor is observed to vary with time t as shown in the graph for a cycle.
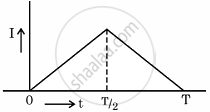
Which one of the following graphs is the correct representation of wave form of voltage V with time t?
Options

Advertisements
Solution
Explanation:
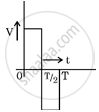
To determine the accurate voltage waveform, we employ the relationship between voltage and current in an inductor: V = Ldl/dt
The given graph shows a triangle waveform for current (I), characterized by a linear increase from t = 0 to t = T/2, followed by a linear decrease from t = T/2 to t = T.
The derivative of a linearly growing function is a constant positive number, while the derivative of a linearly decreasing function is a constant negative value.
Thus, the voltage (V) waveform must exhibit a square wave pattern, maintaining a constant voltage during each half-cycle.
