Advertisements
Advertisements
Question
The activity R of an unknown radioactive nuclide is measured at hourly intervals. The results found are tabulated as follows:
| t (h) | 0 | 1 | 2 | 3 | 4 |
| R (MBq) | 100 | 35.36 | 12.51 | 4.42 | 1.56 |
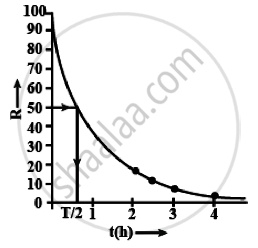
- Plot the graph of R versus t and calculate the half-life from the graph.
- Plot the graph of ln `(R/R_0)` versus t and obtain the value of half-life from the graph.
Graph
Advertisements
Solution
We have listed R(MBq) and In `(R/R_0)` in the table below.
| t (h) | 0 | 1 | 2 | 3 | 4 |
| R (MBq) | 100 | 35.36 | 12.51 | 4.42 | 1.56 |
| `R/R_0` | – | – 1.04 | – 2.08 | – 3.11 | – 4.16 |
i. Graph between R versus t is an exponential curve. From the graph at slightly more than `t = 1/2 h` the R should be 50% so at R = 50% the t(h) = 0.7h
= 0.7 × 60 min
= 42 min
ii. The adjacent figure shows the graph of In `(R/R_0)` versus t.

The slope of this graph = – λ
From the graph,
`λ = - ((-4.16 - 3.11)/1) = 1.05 h^-1`
Hence half-life `T_(1/2) = 0.693/λ = 0.693/1.05` = 0.66 h
= 39.6 min ≈ 40 min
shaalaa.com
Is there an error in this question or solution?
