Advertisements
Advertisements
Question
Study the graph given below and answer the questions that follow:
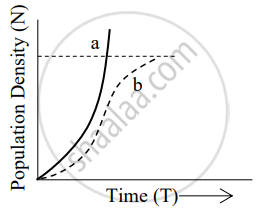
- In the absence of predators which one of the two curves would appropriately depict the prey population? Give a reason.
- Time has been shown on the X-axis, and there is a parallel dotted line shown above. Explain the significance of this dotted line.
Explain
Give Reasons
Advertisements
Solution
- In the absence of predators, the curve ‘a’ represents the exponential growth of prey populations due to a lack of competition for food and shelter resources over time.
- The dotted line in the graph above reflects the population’s carrying capacity (K). The population limit is determined by the environment’s ability to provide adequate resources. The term “habitat limit” refers to the restricted resources available in a certain area that can only support expansion up to a certain point.
shaalaa.com
Is there an error in this question or solution?
