Advertisements
Advertisements
Question
Study the graph and answer the questions that follow:
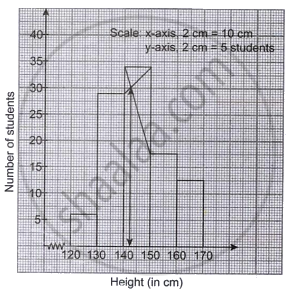
- Make a frequency table for the information provided in the graph.
- The number of students whose height is less than 150 cm.
- The total number of students.
- The modal height.
- The difference in the modal height and the mean height, if the average height of the students is 145.5 cm.
Graph
Advertisements
Solution
a.
| Class | Frequency (f) | Cumulative frequency (c.f.) |
| 120 – 130 | 6 | 6 |
| 130 – 140 | 29 | 35 |
| 140 – 150 | 34 | 69 |
| 150 – 160 | 22 | 91 |
| 160 – 170 | 12 | 103 |
b. From the above table,
The number of students whose height is less than 150 cm = 69.
c. From the above table,
The total number of students = 103.
d. From graph,
The modal height = 143 cm.
e. Mean height = Average height = 145.5
Difference in the modal height and the mean height :
145.5 – 143 = 2.5 cm
Hence, difference between modal height and the mean height = 2.5 cm.
shaalaa.com
Is there an error in this question or solution?
