Advertisements
Advertisements
Question
Students of a class voted for their favourite colour and a pie chart was prepared based on the data collected.
Observe the pie chart given below and answer questions based on it.
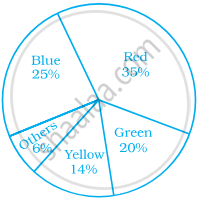
If 400 students voted in all, then how many did vote ‘Others’ colour as their favourite?
Options
6
20
24
40
MCQ
Advertisements
Solution
24
Explanation:
If total number of votes = 400
Then, number of votes in favour of ‘Others’ = 6% of 400
= `6/100 xx 400`
= `3/50 xx 400`
= 24
shaalaa.com
Is there an error in this question or solution?
