Advertisements
Advertisements
Question
Solve the inequalities and represent the solution graphically on number line:
5(2x – 7) – 3(2x + 3) ≤ 0, 2x + 19 ≤ 6x + 47
Advertisements
Solution
5(2x – 7) – 3(2x + 3) ≤ 0
⇒ 10x – 35 – 6x – 9 ≤ 0
⇒ 4x – 44 ≤ 0
⇒ 4x ≤ 44
⇒ x ≤ 11 …(1)
2x + 19 ≤ 6x + 47
⇒ 19 – 47 ≤ 6x – 2x
⇒ –28 ≤ 4x
⇒ –7 ≤ x …(2)
From (1) and (2), it can be concluded that the solution set for the given system of inequalities is [–7, 11]. The solution of the given system of inequalities can be represented on number line as

APPEARS IN
RELATED QUESTIONS
Solve the given inequality graphically in two-dimensional plane: x + y < 5
Solve the given inequality graphically in two-dimensional plane: 3x + 4y ≤ 12
Solve the given inequality graphically in two-dimensional plane: y + 8 ≥ 2x
Solve the given inequality graphically in two-dimensional plane: x – y ≤ 2
Solve the given inequality graphically in two-dimensional plane: –3x + 2y ≥ –6
Solve the given inequality graphically in two-dimensional plane: 3y – 5x < 30
Solve the inequalities and represent the solution graphically on number line:
5x + 1 > –24, 5x – 1 < 24
Solve the inequality and represent the solution graphically on number line:
2(x – 1) < x + 5, 3(x + 2) > 2 – x
IQ of a person is given by the formula
IQ = `(MA)/(CA) xx100`
Where MA is mental age and CA is chronological age. If 80 ≤ IQ ≤ 140 for a group of 12 years old children, find the range of their mental age.
Solve the following systems of linear inequation graphically:
2x + 3y ≤ 6, 3x + 2y ≤ 6, x ≥ 0, y ≥ 0
Solve the following systems of linear inequation graphically:
2x + 3y ≤ 6, x + 4y ≤ 4, x ≥ 0, y ≥ 0
Solve the following systems of linear inequations graphically:
x − y ≤ 1, x + 2y ≤ 8, 2x + y ≥ 2, x ≥ 0, y ≥ 0
Solve the following systems of linear inequations graphically:
x + y ≥ 1, 7x + 9y ≤ 63, x ≤ 6, y ≤ 5, x ≥ 0, y ≥ 0
Solve the following systems of linear inequations graphically:
2x + 3y ≤ 35, y ≥ 3, x ≥ 2, x ≥ 0, y ≥ 0
Show that the solution set of the following linear in equations is an unbounded set:
x + y ≥ 9
3x + y ≥ 12
x ≥ 0, y ≥ 0
Solve the following systems of inequations graphically:
12x + 12y ≤ 840, 3x + 6y ≤ 300, 8x + 4y ≤ 480, x ≥ 0, y ≥ 0
Solve the following systems of inequations graphically:
x + 2y ≤ 40, 3x + y ≥ 30, 4x + 3y ≥ 60, x ≥ 0, y ≥ 0
Solve the following systems of inequations graphically:
5x + y ≥ 10, 2x + 2y ≥ 12, x + 4y ≥ 12, x ≥ 0, y ≥ 0
Show that the following system of linear equations has no solution:
\[x + 2y \leq 3, 3x + 4y \geq 12, x \geq 0, y \geq 1\]
Mark the correct alternative in each of the following:
If x\[<\]7, then
Find the linear inequalities for which the shaded region in the given figure is the solution set.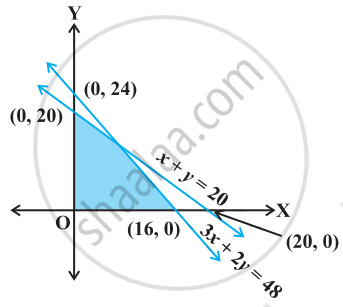
State which of the following statement is True or False.
If x < y and b < 0, then `x/"b" < y/"b"`
State which of the following statement is True or False.
If xy > 0, then x > 0 and y < 0
Graph of x < 3 is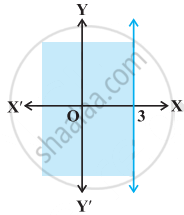
Graph of x ≥ 0 is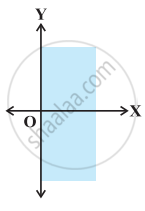
Solution set of x + y ≥ 0 is