Advertisements
Advertisements
Question
Solve the following system of linear equations graphically and shade the region between the two lines and x-axis:
2x + 3y = 12
x – y = 1
Advertisements
Solution
The given equation is
2x + 3y = 12 ......(i)
x − y = 1 .......(ii)
Putting x = 0 in equation (i) we get
`=> 2xx0 + 3y = 12`
`=> y = 4`
Putting y = 0 in equation (i) we get
`=> 2x + 3 xx 0 = 12`
`=> x = 6`
x = 6, y = 0
Use the following table to draw the graph.
| x | 0 | 6 |
| y | 4 | 0 |
Draw the graph by plotting the A(0, 4), B(6, 0) two points from table
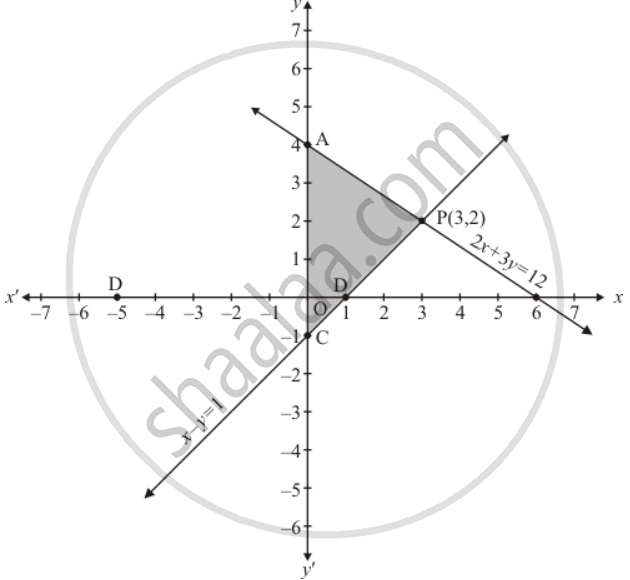
x - y = 1 ....(ii)
Putting x = 0 in equation (ii) we get
`=> 0 - y = 1`
`=> y = -1`
x = 0, y = -1
Putting y = 0 in equation (ii) we get
`=> x - 0 = 1`
`=> x = 1`
x = 1, y = 0
Use the following table to draw the graph.
| x | 0 | 1 |
| y | -1 | 0 |
Draw the graph by plotting the two points C(0, -1), D(1, 0) from table.
The two lines intersect at P(3, 2). The region enclosed by the lines represented by the given equations and x-axis are shown in the above figure
Hence, x = 3 and y = 2 is the solution.
