Advertisements
Advertisements
Question
Solve graphically
x = −3, y = 3
Advertisements
Solution
x = −3
| x | −3 | −3 | −3 | −3 |
| y | −3 | −2 | −2 | 3 |
Plot the points (−3, −3), (−3, −2), (−3, 2) and (−3, 3) in the graph sheet
y = 3
| x | −3 | −1 | 0 | 2 |
| y | 3 | 3 | 3 | 3 |
Plot the points (−3, 3), (−1, 3), (0, 3) and (2, 3) in the same graph sheet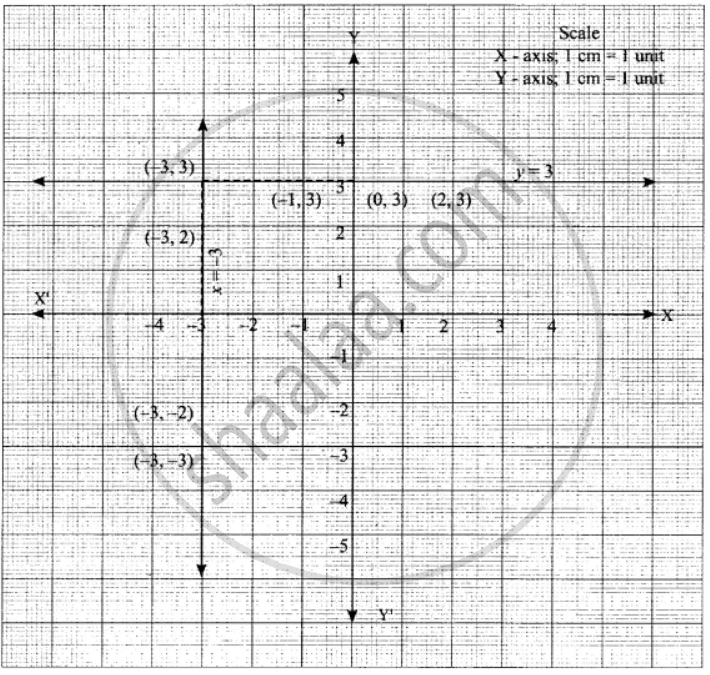
The two lines l1 and l2 intersect at (−3, 3)
∴ The solution set is (−3, 3)
APPEARS IN
RELATED QUESTIONS
The cost of manufacturing x articles is Rs. (50 + 3x). The selling price of x articles is Rs. 4x.
On a graph sheet, with the same axes, and taking suitable scales draw two graphs, first for the cost of manufacturing against no. of articles and the second for the selling price against the number of articles.
Use your graph to determine:
No. of articles to be manufactured and sold to break even (no profit and no loss).
Find graphically, the vertices of the triangle whose sides have the equations 2y - x = 8; 5y - x = 14 and y - 2x = 1 respectively. Take 1 cm = 1 unit on both the axes.
Using the same axes of co-ordinates and the same unit, solve graphically :
x + y = 0 and 3x - 2y = 10.
(Take at least 3 points for each line drawn).
Solve the following equations graphically :
x + 3y = 8
3x = 2 + 2y
Solve the following equations graphically :
x + 4y + 9 = 0
3y = 5x - 1
Solve the following equations graphically :
`2 + (3y)/x = (6)/x`
`(6x)/y - 5 = (4)/y`
Find graphically the vertices of the triangle, whose sides have the equations 2y - x = 8, 5y -x = 14 and y = 2x - 1.
Draw the graph of the following equations :
3x + 2y + 6 = 0
3x + 8y - 12 = 0
Also, determine the co-ordinates of the vertices of the triangle formed by these lines and x-axis.
Solve graphically
x + y = 7, x – y = 3
Solve graphically
3x + 2y = 4, 9x + 6y – 12 = 0
