Advertisements
Advertisements
Question
Sketch the graphs of the following functions:
f(x) = tan 2x
Short/Brief Note
Advertisements
Solution
Step I- We find the value of c and a by comparing y = 2 tan 2x with y = c tan ax, i.e. c = 1 and a = 2.
Step II- Then, we draw the graph of y = tan x and mark the point where it crosses the x-axis.
Step III- Divide the x-coordinates of the points where y = tan x crosses x-axis by 2(i.e. a = 2) and mark the maximum value (i.e. c = 1) and minimum value (i.e. -c = -1).
Then , we obtain the following graph: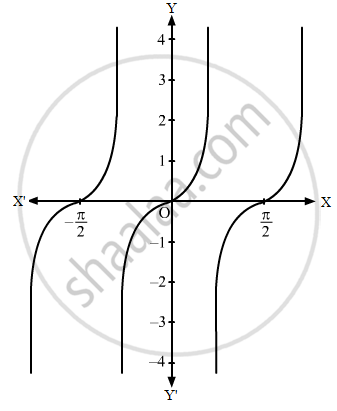
shaalaa.com
Is there an error in this question or solution?
