Advertisements
Advertisements
Question
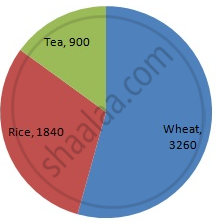
Represent the following data with the help of a pie-diagram:
| Items | Wheat | Rice | Tea |
| Production (in metric tons) | 3260 | 1840 | 900 |
Advertisements
Solution
We know:
Central angle of a component = (component value/sum of component values x 360)
Here, total production = 6000 (in metric tons)
Thus, the central angle for each component can be calculated as follows:
| Item | Production (in metric tons) |
Sector angle |
| Wheat | 3260 | 3260/6000 x 360 = 195.6 |
| Rice | 1840 | 1840/6000 x 360 =1 10.4 |
| Tea | 900 | 900/6000 x 360 = 54 |
Total = 6000 (in metric tons)
Now, the pie chat representing the given data can be constructed by following the steps below:
Step 1 : Draw circle of an appropriate radius.
Step 2 : Draw a vertical radius of the circle drawn in step 1.
Step 3 : Choose the largest central angle. Here, the largest central angle is 195.6o. Draw a sector with the central angle 195.6 o in such a way that one of its radii coincides with the radius drawn in step 2 and another radius is in its counter clockwise direction.
Step 4 : Construct the other sectors representing the other items in the clockwise direction in descending order of magnitudes of their central angles.
Step 5 : Shade the sectors with different colours and label them as shown in the figure below.