Advertisements
Advertisements
Question
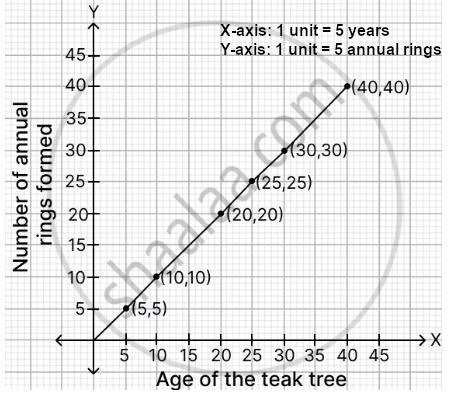
Plot a graph between the age of a tree (in years) on the x-axis and the diameter of the tree (in cm) along with the number of annual rings formed over time on the y-axis, using the data given in the Table.
| Data related to the age of a teak tree, and corresponding increase in the diameter of stem and number of annual rings |
|||
| S. No. | Age of the teak tree (Years) | DBH (Diameter at Breast Height) of tree (cm) | Number of annual rings formed |
| 1. | 5 | 4 | 5 |
| 2. | 10 | 8 | 10 |
| 3. | 20 | 24 | 20 |
| 4. | 25 | 28 | 25 |
| 5. | 30 | 32 | 30 |
| 6. | 40 | 40 | 40 |
- Analyse the graph in terms of the diameter of the stem over time and share the interpretation.
- What is the relation between the diameter of the teak tree to the annual rings formed?
- Which specialised tissue is responsible for the girth of the stem and where is it located?
Graph
Very Long Answer
Advertisements
Solution
The plotted graphs are as follows:
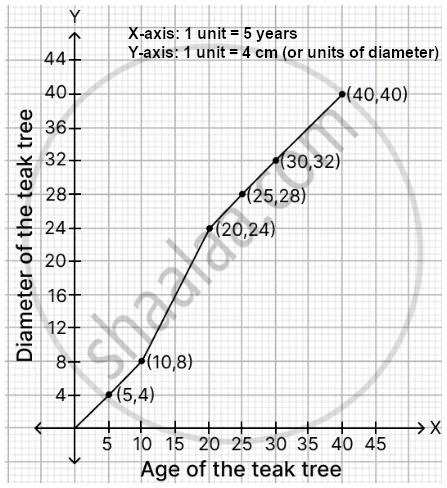
- The graph shows that the tree’s diameter (DBH) rises with age. The curve goes gradually upwards, indicating that the stem thickens (girth increases) over time. The constant increase in diameter is due to the activity of the meristematic tissue, which adds new cells year after year.
- The diameter of a teak tree and the number of annual rings are directly related. Each year, one annual ring is generated; the total number of annual rings equals the tree’s age. The diameter of the tree grows in proportion to the number of annual rings. As a result, the diameter rises proportionally with the number of annual rings.
- The lateral meristem (also known as the lateral or vascular cambium) is responsible for the stem’s increased girth. It is placed along the circle of the stem, grouped as a ring, and splits to produce new cells on the inside and outside, increasing the diameter.
shaalaa.com
Is there an error in this question or solution?
