Advertisements
Advertisements
Question
Observe the graph and answer the following questions:
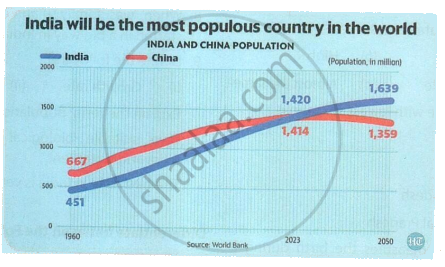
- What do you understand from the graph?
- China’s population is more than India’s. How has it been able to reduce its growth than India? Justify by giving examples.
Very Long Answer
Advertisements
Solution
(i) The graph shows that between 1960 and 2023, both India and China experienced rapid population growth. However, around 2023, the population curves cross each other, showing that India surpasses China to become the most populous country in the world. Beyond 2023, China’s population shows a downward/declining projection toward 2050, while India’s population continues to grow before leveling off.
(ii) China managed to restrict its growth curve dramatically compared to India through strict, state-enforced family planning policies:
- The One-Child Policy (1979): China introduced a mandatory rule restricting ethnic Han couples to having only one child.
- Strict Implementation and Incentives: The policy was reinforced using strict administrative measures, including economic incentives (better jobs/housing for single-child families) and heavy financial penalties for violations. This rapidly pulled down China's growth rate, whereas India relied entirely on voluntary family planning choices.
shaalaa.com
Is there an error in this question or solution?
