Advertisements
Advertisements
Question
Observe the following table and answer the questions given below it:
| Price in ₹ | Qty. supplied in units |
| 10 | 200 |
| 15 | ______ |
| 20 | 300 |
| 25 | 350 |
| 30 | ______ |
| 35 | ______ |
| 40 | ______ |
- Complete the above supply schedule.
- Draw a diagram for the above supply schedule.
Diagram
Numerical
Advertisements
Solution
a. Completed Supply Schedule:
| Price (₹) | Quantity Supplied (Units) |
| 10 | 200 |
| 15 | 250 |
| 20 | 300 |
| 25 | 350 |
| 30 | 400 |
| 35 | 450 |
| 40 | 500 |
b. 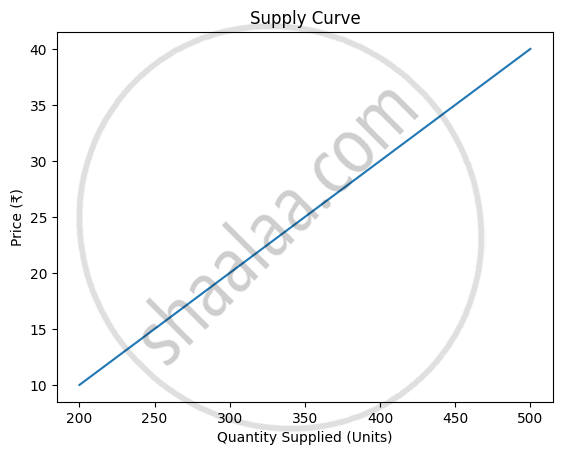
Explanation:
As price increases by ₹ 5, quantity supplied increases by 50 units (showing a direct relationship between price and supply).
The above diagram shows an upward sloping supply curve, indicating that supply increases with increase in price (Law of Supply).
shaalaa.com
Is there an error in this question or solution?
2025-2026 (March) Board Question Paper
