Advertisements
Advertisements
Question
Observe the diagram given below and answer the questions that follow.
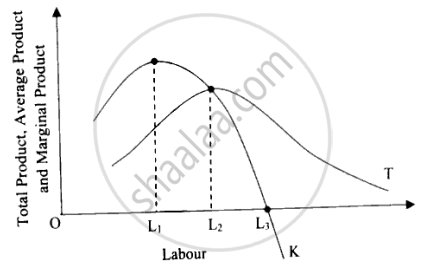
- Identify the curves labelled ‘K’ and ‘T’. Name the stage of return in operation within the range of employment, L2L3. [2]
- Producer is reluctant to produce in the stage of production depicted by the range L2L3. Defend or refute the statement with a reason. [2]
- Briefly explain any two reasons of operation of negative return to a factor. [2]
Explain
Give Reasons
Advertisements
Solution
- K = Marginal Product (MP) curve; T = Total Product (TP) curve. The employment range L2–L3 is Stage II, the stage of diminishing returns (the normal/rational stage of production).
- Refute. A producer is not reluctant to produce in L2–L3; this is precisely the preferred range (stage II) because total product is still rising (though at a diminishing rate) and marginal product is positive until L3, so additional labour still increases output. Rational firms therefore operate in stage II rather than in stage I or stage III.
- Two reasons for negative returns to a factor (stage III):
- Overcrowding: Too many units of the variable factor (e.g., workers) per fixed input reduces productivity because workers get in each other’s way and have fewer tools/resources per person.
- Management problems: With excessive numbers of the variable factor it becomes harder to supervise and coordinate work; shirking, poor accountability and inefficiency increase, lowering marginal product.
shaalaa.com
Is there an error in this question or solution?
2025-2026 (March) Official Board Paper
