Advertisements
Advertisements
Question
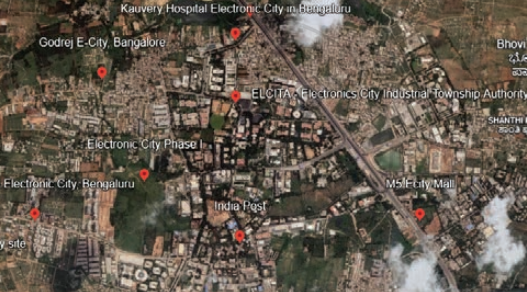
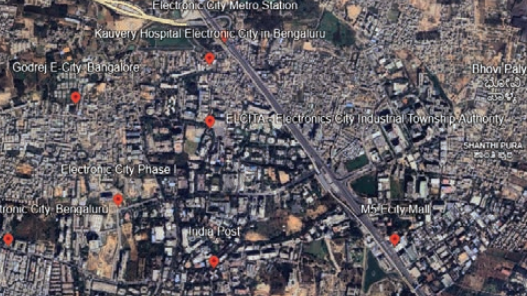
Observe and compare the two satellite images of an area of Bengaluru (Fig.). They are from 2012 and 2025, respectively. What are your observations? What has changed? Guess what might be the causes for the change.
 |
 |
Advertisements
Solution
The 2025 satellite image shows a significant increase in built-up areas compared with 2012. There are more buildings, roads, and other infrastructure, showing rapid urbanisation. At the same time, the amount of green and open space has decreased.
The main reasons for this change are rapid economic growth, especially in the IT sector, and migration of people from other parts of India in search of jobs. Government policies promoting industrial and IT development have also encouraged urban expansion. In addition, limited urban planning has resulted in unplanned growth and the conversion of green and agricultural land into built-up areas.
