English

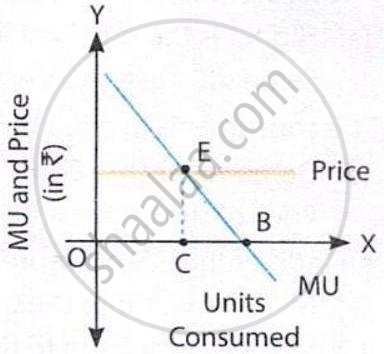
In the given diagram, the situation of Consumer’s Equilibrium and Point of Satiety are represented by the points:
Advertisements
Advertisements

Question

In the given diagram, the situation of Consumer’s Equilibrium and Point of Satiety are represented by the points:

 The graph shows consumer’s equilibrium at point E, where Marginal Utility (MU) equals Price. At this point, the consumer gets maximum satisfaction.

Options

  • Point C and Point E

  • Point E and Point B

  • Point B and Point E

  • Point B and Point C

MCQ
Advertisements

Solution

Point E and Point B

Explanation:

The diagram identifies E as consumer equilibrium, where MU equals price, and B as the point of satiety. Thus, the ordered pair is Point E and Point B.

shaalaa.com
  Is there an error in this question or solution?
Chapter 2: Consumer's Equilibrium - OBJECTIVE QUESTIONS [Page 2.50]

APPEARS IN

Sandeep Garg Introductory Microeconomics [English] Class 11
Chapter 2 Consumer's Equilibrium
OBJECTIVE QUESTIONS | Q 52. | Page 2.50
Share
Notifications

Englishहिंदीमराठी


      Forgot password?
Use app×