Advertisements
Advertisements
Question
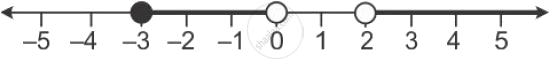
Illustrate the set {x : –3 ≤ x < 0 or x > 2; x ∈ R} on the real number line.
Sum
Advertisements
Solution
Graph of solution set of –3 ≤ x < 0 or x > 2
= Graph of points which belong to –3 ≤ x < 0 or x > 2 or both
Thus, the required graph is:
shaalaa.com
Is there an error in this question or solution?
Chapter 4: Linear Inequations (In one variable) - Exercise 4 (B) [Page 49]
