Advertisements
Advertisements
Question
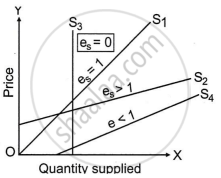
Identify and define the degree of price elasticity of supply from the diagram for the supply curves S1, S2, S3, S4.
Advertisements
Solution
The supply curves S1, S2, S3, and S4 exhibit various types of price elasticity of supply, which are as follows: The S1 - OS1 supply curve demonstrates Unitary Elastic Supply since the change in the amount supplied is proportional to the change in price. Symbolically, it is expressed as Es = 1.
The S2 - OS2 supply curve demonstrates More Elastic Supply because a little change in price causes a significant change in quantity delivered. Symbolically, it is expressed as Es > 1.
The S3 - OS3 supply curve demonstrates Perfectly Inelastic Supply, which means that a change in price causes no change in supply. Symbolically, it is expressed as Es = 0.
The S4 - OS4 supply curve demonstrates Less Elastic Supply since a change in price results in a modest change in supply. Symbolically, it is expressed as Es < 1.
APPEARS IN
RELATED QUESTIONS
Explain briefly the impact of the cost of production on the elasticity of supply.
With the help of a suitable diagram, explain the following degree of elasticity of supply.
Es = ∞
Draw a well-labelled diagram showing the price elasticity of supply of a commodity starting from the origin.
The given diagram is a case of ______ supply.

Which of the following statements are true?
The cost of production will increase if
- The government gives subsidies
- The firm uses obsolete technology
- The price of diesel increases
When the price increases by 50% and the supply increases only by 5% the price elasticity of supply of that commodity will be ______.
Elasticity of supply is measured by:
The quantity of a commodity supplied increases by 25% when its price rises by 10%. Calculate price elasticity of supply.
The price of a commodity rises from ₹ 20 to ₹ 40 Consequently, its supply increases from 100 units to 400 units. Calculate price elasticity of supply.
Explain any four determinants of elasticity of supply.
Draw the supply curve showing price elasticity of supply greater than one.
Draw the supply curve showing price elasticity of supply less than one.
Draw and explain the following degree of elasticity of supply.
Ep > 1
Why does the measure of price elasticity of supply of a good carry plus sign?
When is supply of a good unitary elastic?
Price elasticity of supply of a good is 0.8. Is the supply 'elastic' or 'inelastic', and why?
Draw a straight line supply curve of the following situation.
More than unitary elastic
With the help of a suitable diagram, explain the following degree of elasticity of supply.
Es > 1
