Advertisements
Advertisements
Question

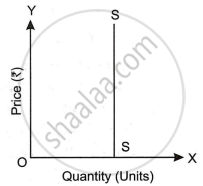
Identify the elasticity of supply (es) of S1, S2 and S3 supply curves:
Options
All have es > 1
All have es < 1
All have es = 1
All have es = 0
Advertisements
Solution
All have es > 1
Explanation:
In graphical presentation, when supply curves begin on the Y axis, the elasticity of supply is greater than 1. A curve beginning on the y axis indicates that even at a price close to zero, suppliers are prepared to deliver a certain number of goods. As the price rises, the quantity supplied grows at a faster rate, indicating high elasticity.
RELATED QUESTIONS
With the help of a suitable diagram, explain the following degree of elasticity of supply.
Es = ∞
Draw a well-labelled diagram showing the price elasticity of supply of a commodity starting from the origin.
Draw a perfectly elastic supply curve.
What is the formula for percentage method of calculating price elasticity of supply?
What is the degree of elasticity of supply in the diagram?
Which of the following measures of price elasticity shows elasticity shows elastic supply?
If price elasticity of supply is greater than 1, then supply is said be elastic.
- Price elasticity of supply of a good is 0.8, its supply is said to be inelastic.
- If the quantity supplied of a commodity remain the same whatever its price supply is said to perfectly inelastic.
The coefficient of elasticity of a commodity is 0.4. What percentage change in supply will take place if its price rises 20%?
Cotton and cotton seeds are examples of ______ supply.
Draw and briefly explain a perfectly elastic supply curve.
If the price of a commodity increases by 50% and its supply increases by 25% then calculate the price elasticity of supply following the percentage method. Identify the degree of price elasticity.
Give the meaning of perfectly elastic supply.
Give the meaning of perfectly inelastic supply.
Draw and explain the following degree of elasticity of supply.
Ep > 1
Price elasticity of supply of a good is 0.8. Is the supply 'elastic' or 'inelastic', and why?
Draw relatively inelastic supply.
Draw relatively elastic supply.
