Advertisements
Advertisements
Question
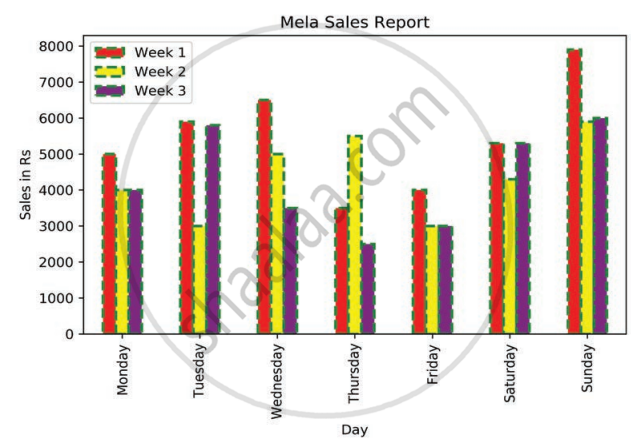
How can we make the bar chart of the figure horizontal?
Very Short Answer
Advertisements
Solution
- Change the function: Replace
plt.bar()with plt.barh()in your code. - Swap the labels:
Change plt.xlabel("Day")toplt.ylabel("Day")and change plt.ylabel("Sales in Rs") toplt.xlabel("Sales in Rs").
shaalaa.com
Is there an error in this question or solution?
