English

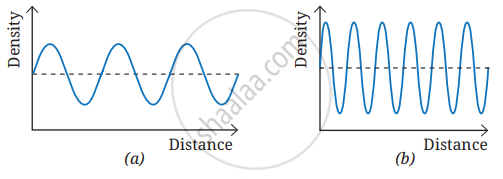
Graphs representing two sound waves are given in Fig. 10.30. If the scales on the X and Y axes of the two graphs are the same, which of the two sound waves has (i) greater wavelength, and

Advertisements
Advertisements

Question

Graphs representing two sound waves are given in Fig. 10.30. If the scales on the X and Y axes of the two graphs are the same, which of the two sound waves has

  1. greater wavelength 
  2. smaller amplitude

Very Short Answer
Advertisements

Solution

The wave with fewer density oscillations in the same distance has the greater wavelength. The wave with the smaller deviation of density from the average value has the smaller amplitude.

shaalaa.com
  Is there an error in this question or solution?
Chapter 10: Sound Waves: Characteristics and Applications - Revise, Reflect, Refine [Page 205]

APPEARS IN

NCERT Science Exploration [English] Class 9
Chapter 10 Sound Waves: Characteristics and Applications
Revise, Reflect, Refine | Q 5. | Page 205
Share
Notifications

Englishहिंदीमराठी


      Forgot password?
Use app×