Advertisements
Advertisements
Question
For the following distribution draw a ‘less than type’ ogive and from the curve find the median.
| Marks obtained |
Less than 20 |
Less than 30 |
Less than 40 |
Less than 50 |
Less than 60 |
Less than 70 |
Less than 80 |
Less than 90 |
Less than 100 |
| Number of students |
2 | 7 | 17 | 40 | 60 | 82 | 85 | 90 | 100 |
Advertisements
Solution
1. Identify the coordinates for plotting
To plot a ‘less than type’ ogive, take the upper class limits on the X-axis and their corresponding cumulative frequencies on the Y-axis. The points to be plotted on your graph paper are:
| Upper Class Limits (X-axis) |
Cumulative Frequency (Y-axis) |
Points (x, y) |
| Less than 20 | 2 | (20, 2) |
| Less than 30 | 7 | (30, 7) |
| Less than 40 | 17 | (40, 17) |
| Less than 50 | 40 | (50, 40) |
| Less than 60 | 60 | (60, 60) |
| Less than 70 | 82 | (70, 82) |
| Less than 80 | 85 | (80, 85) |
| Less than 90 | 90 | (90, 90) |
| Less than 100 | 100 | (100, 100) |
2. Plot the cumulative frequency curve (Ogive)
- Choose an appropriate scale on your graph paper (e.g., 1 cm = 10 units on both axes).
- Plot the coordinate points from the table above and join them using a smooth free-hand curve.
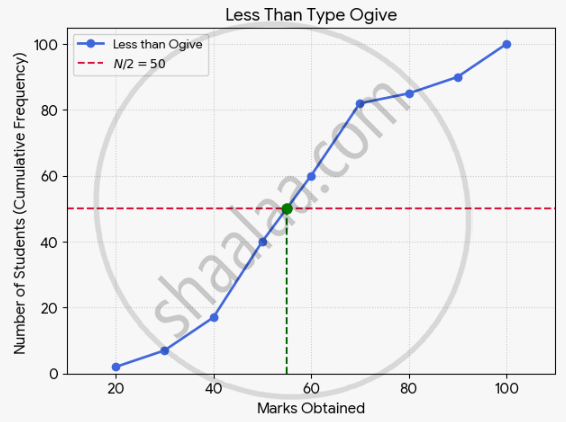
3. Find the median from the curve
1. Compute the middle position of the data, which is given by `N/2`, where N = 100 (total number of students):
`N/2 = 100/2 = 50`
2. Locate the value 50 on the Y-axis (cumulative frequency).
3. Draw a horizontal line from y = 50 parallel to the X-axis until it intersects the curve.
4. From this intersection point, drop a perpendicular line vertically down to the X-axis.
5. The point where this line intersects the X-axis yields the value 55, which is the graphical median.
