Advertisements
Advertisements
Question
For the curve y = x3 given in Figure 1.67, draw
y = (x + 1)3 with the same scale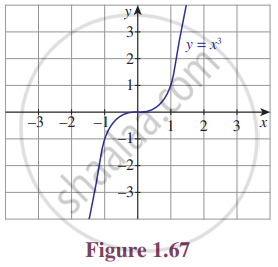
Advertisements
Solution
y = (x + 1)3
| x | 0 | 1 | – 1 | 2 | – 2 |
| y | 1 | 8 | 0 | 27 | – 1 |

The graph y = (x + 1)3 causes the graph of y = x3 a shift to the left by 1 unit.
The graph of y = f(x + c), c > 0 causes the graph y = f(x) a shift to the left by c units.
APPEARS IN
RELATED QUESTIONS
For the curve y = x3 given in Figure 1.67, draw
y = −x3
For the curve y = x3 given in Figure 1.67, draw
y = x3 + 1
For the curve y = `x^((1/3))` given in Figure 1.68, draw
y = `- x^((1/3))`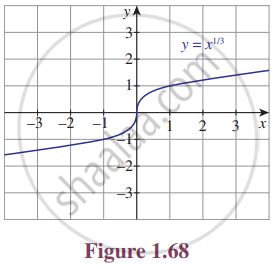
For the curve y = `x^((1/3))` given in Figure 1.68, draw
y = `x^((1/3)) + 1`
For the curve y = `x^((1/3))` given in Figure 1.68, draw
y = `x^((1/3)) - 1`
Write the steps to obtain the graph of the function y = 3(x − 1)2 + 5 from the graph y = x2
From the curve y = sin x, graph the function.
y = sin(− x)
From the curve y = sin x, graph the function
y = − sin(−x)
From the curve y = sin x, graph the function
y = `sin(pi/2 + x)` which is cos x
From the curve y = x, draw y = − x
From the curve y = x, draw y = 2x
From the curve y = x, draw y = x + 1
From the curve y = x, draw y = `1/2 x + 1`
From the curve y = x, draw 2x + y + 3 = 0
From the curve y = |x|, draw y = |x − 1| + 1
From the curve y = |x|, draw y = |x + 1| − 1
From the curve y = |x|, draw y = |x + 2| − 3
From the curve y = sin x, draw y = sin |x| (Hint: sin(−x) = − sin x)
