Advertisements
Advertisements
Question
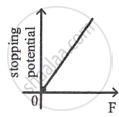
Following graphs show the variation of stopping potential corresponding to the frequency of incident radiation (F) for a given metal. The correct variation is shown in graph (v0 = Threshold frequency).
Options


MCQ
Graph
Advertisements
Solution
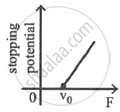
Explanation:
The following diagram illustrates how the stopping potential changes depending on the frequency of the incident radiation (F).
shaalaa.com
Is there an error in this question or solution?
