English
Karnataka Board PUCPUC Science Class 11

Figure (3-e4) Shows the Graph of The X-coordinate of a Particle Going Along the X-axis as a Function of Time. Find the Average Velocity During 0 to 10 S, - Physics

Advertisements
Advertisements

Question

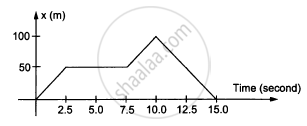
In the following figure shows the graph of the x-coordinate of a particle going along the X-axis as a function of time. Find the average velocity during 0 to 10 s,

Short/Brief Note
Advertisements

Solution

Displacement from t = 0 s to = 10 s:
x = 100 m
Time = 10 s
Average velocity from 0 to 10 seconds,

\[v_{avg} = \frac{x}{t} = \frac{100}{10} = 10 \text{ m } /s\]

shaalaa.com
  Is there an error in this question or solution?
Chapter 3: Rest and Motion: Kinematics - Exercise [Page 51]

APPEARS IN

HC Verma Concepts of Physics Vol. 1 [English] Class 11 and 12
Chapter 3 Rest and Motion: Kinematics
Exercise | Q 9.1 | Page 51
Share
Notifications

Englishहिंदीमराठी


      Forgot password?
Use app×