Advertisements
Advertisements
Question
Explain the shape of a supply curve.
Explain
Advertisements
Solution
The law of supply is represented diagrammatically by a supply curve. The information it conveys is identical to that of a supply schedule. However, rather than using numerical figures, it presents this information graphically. The assumptions and explanation of a supply curve are identical to those of a supply schedule. Similar to the supply schedule, there are two types of supply curves:
- Individual Supply Curve: The term "individual supply curve" refers to a curve that illustrates the range of quantities of a certain commodity that a single producer is willing to supply at varying prices over a specified time period, presuming that the only variable influencing supply of the commodity is the producer's own price. To create an individual supply curve, the specified table's individual supply schedule is visually drawn, as seen in Fig. below.
Individual Supply Schedule for Good X
Price of Good X (₹ per kg) Quantity Supplied of Good X (kg per month) Points on Supply Curve 10 5,000 A 15 10,000 B 20 16,000 C 25 25,000 D 30 35,000 E 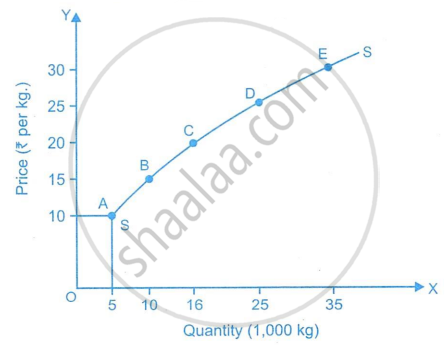
With the price on the Y-axis and the quantity delivered on the X-axis, the five points A, B, C, D, and E that correspond to each price-quantity combination in the table are plotted in Fig. The supply curve, or curve SS, is obtained by passing a smooth curve through these five locations. The slope of the supply SS is positive. A commodity's price and supply quantity are directly correlated, as seen by the positively sloping supply curve (SS). - Market Supply Curve: The market supply curve is a graph that, under the assumption that all other variables, excluding the product's price, stay constant throughout time, displays the varied amounts of a good that all producers are willing to create and sell at various prices. The market supply curve SS in Fig. represents the market supply schedule of Table.
Market Supply Schedule for Good X
Price of Good X (₹ per kg) Quantity Supplied of Good X (1000 kg per month) Points on Supply Curve 10 90 A 15 180 B 20 280 C 25 460 D 30 620 E 
shaalaa.com
Is there an error in this question or solution?
