Advertisements
Advertisements
Question
Explain the relative positions of mean, median, and mode in a Skewed Distribution with the help of diagrams.
Diagram
Explain
Advertisements
Solution
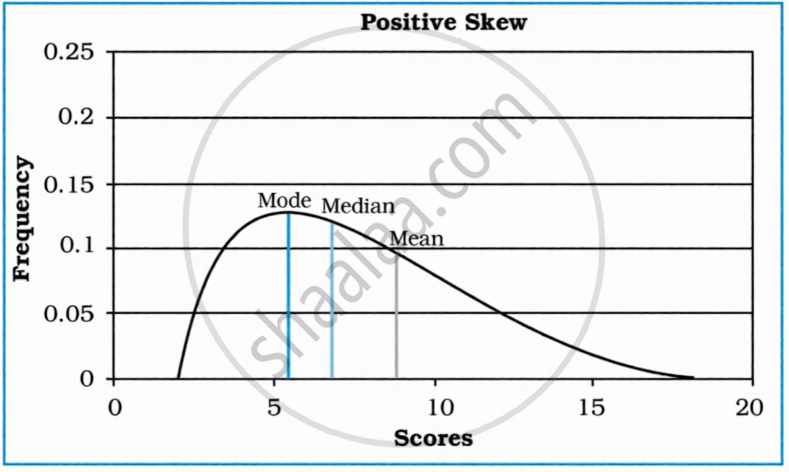
In a Skewed Distribution (also known as an Asymmetrical Distribution), the data is not evenly distributed, causing the curve to have a long tail on one side. Depending on the direction of the tail, a skewed distribution is divided into two types, which change the relative positions of the measures:
- Positively Skewed Curve: It is an asymmetrical curve with a tail on the right-hand side of the graph, and the frequencies are higher at lower data values. These histograms have the curve on the left side of the distribution. If the right tail is longer, the distribution’s mass is concentrated on the left. It has relatively few high values. It is shown below:
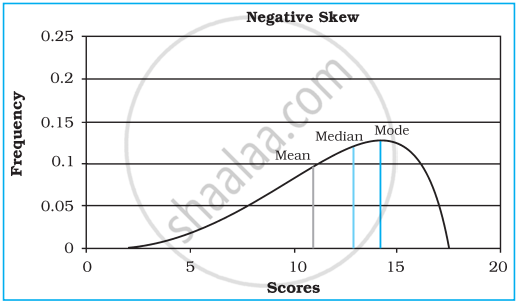
- Negatively Skewed Curve: It is an asymmetrical curve that has a tail on the left-hand side of the graph, and frequencies are more for the higher values of the data. The left tail is longer, and the mass of the distribution is concentrated on the right of the figure. It has relatively few low values. The distribution is left-skewed. It is shown below:
shaalaa.com
Is there an error in this question or solution?
Chapter 2: Data Processing - Exercises [Page 22]
