Advertisements
Advertisements
Question
Explain the diagram given below.
Answer in Brief
Advertisements
Solution
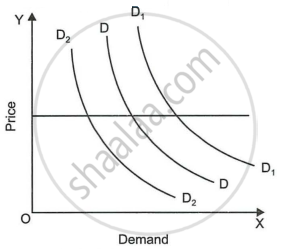
The diagram shows change in demand. DD is the initial demand curve. Price remaining the same (at OP level), when demand rises due to changes in factors other than price, the demand curve shifts from DD to D1D1, indicating an increase in demand. The demand curve shifts to the left, as denoted by demand curve D2D2 indicates a decrease in demand when other factors become unfavourable.
shaalaa.com
Is there an error in this question or solution?
Chapter 2: Elementary Theory of Demand - QUESTIONS [Page 59]
