Advertisements
Advertisements
Question
Advertisements
Solution
We know C/100 = (F - 32)/180.
C =5/9(F - 32)
C = 5/9F - 17.77.
The graph between T°C and T°F is a straight line having a slope of 5/9 and the intercept on the Y-axis is-17.77.

APPEARS IN
RELATED QUESTIONS
Define temperature on the basis of the kinetic theory of matter.
Write down the SI unit of latent heat.
What is the relation between α and γ?
Give a scientific reason for the following:
In winter the human body covered with a blanket keeps warm.
Out of metals, liquids, and gases:
Which one is worst conductor of heat?
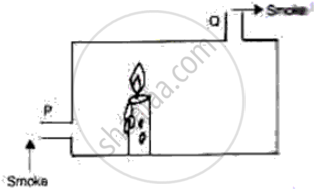
The following figure shows a container in which a lighted candle has been kept. The container has two openings, p, and Q. Which way the smoke from an external source placed near P moves when it reaches P and leaves from Q. Give a reason for your answer.
A small change in the temperature causes change in ______ of a liquid.
