Advertisements
Advertisements
Question
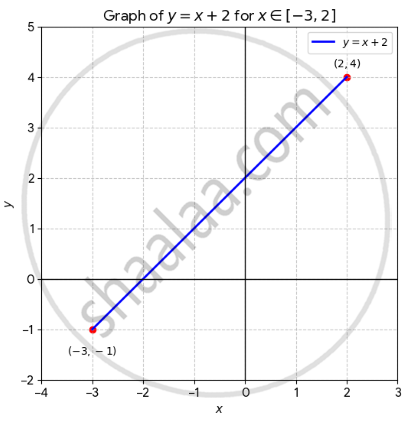
Draw the graph of y = x + 2 from x = –3 to x = 2.
Advertisements
Solution
1. Calculate endpoints
To draw the line segment accurately, we evaluate the function at the boundaries of the given domain:
When x = –3: y = (–3) + 2 = 1.
This gives the point (–3, –1).
When x = 2: y = (2) + 2 = 4.
This gives the point (2, 4).
2. Identify intercepts
Finding where the line crosses the axes helps in placement:
y-intercept: Set x = 0, then y = 2.
Point: (0, 2).
x-intercept: Set y = 0, then 0 = x + 2
⇒ x = –2.
Point: (2, 0).
3. Analyze slope
The equation is in the slope-intercept form y = mx + b, where m = 1. This means for every 1 unit moved to the right, the line rises by 1 unit.
The graph of y = x + 2 from x = –3 to x = 2 is a straight line segment starting at the point (–3, –1) and ending at the point (2, 4).
