Advertisements
Advertisements
Question
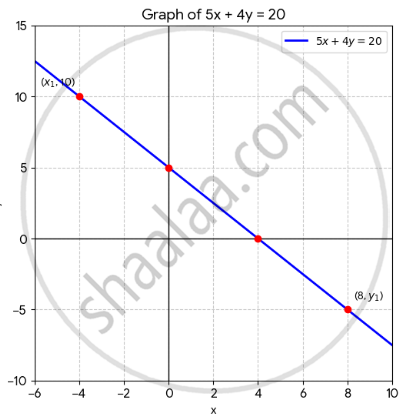
Draw the graph of equation 5x + 4y = 20. Use the graph drawn to find:
- x1, the value of x, when y = 10.
- y1, the value of y, when x = 8.
Advertisements
Solution
To plot the graph of the linear equation 5x + 4y = 20, we find its intercepts with the axes and then use the graph to determine specific values of x and y.
1. Determining the intercepts
To draw a straight line, we need at least two points. The easiest points to find are the x and y intercepts:
x-intercept: Set y = 0 in the equation:
5x + 4(0) = 20
⇒ 5x = 20
⇒ x = 4
The x-intercept is at (4, 0).
y-intercept: Set x = 0 in the equation:
5(0) + 4y = 20
⇒ 4y = 20
⇒ y = 5
The y-intercept is at (0, 5).
2. Graph of 5x + 4y = 20
Plot these two points on a cartesian plane and draw a straight line through them.
3. Finding specific values from the graph
i. Value of x1 when y = 10:
Look at the y-axis at 10 and move horizontally to the line. From that point, move downtothe x-axis.
Mathematically: 5x + 4(10) = 20
⇒ 5x + 40 = 20
⇒ 5x = –20
⇒ x = –4
So, x1 = –4.
ii. Value of y1 when x = 8:
Look at the x-axis at 8 and move vertically to the line. From that point, move across to the y-axis.
Mathematically: 5(8) + 4y = 20
⇒ 40 + 4y = 20
⇒ 4y = –20
⇒ y = –5
So, y1 = –5.
