Advertisements
Advertisements
Question
Draw a graph between displacement from mean position and time for a body executing free vibrations in vacuum.
Advertisements
Solution
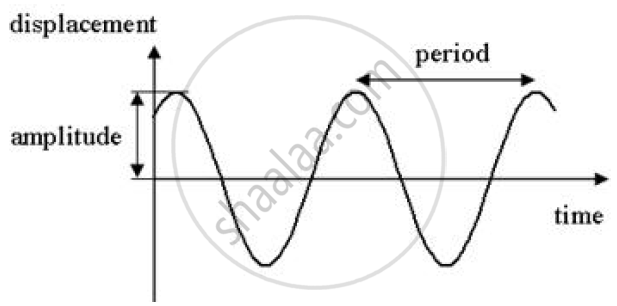
Displacement-time graph for the free vibrations
RELATED QUESTIONS
Write the audible range of frequency for the normal human ear.
What type of wave is represented :
(a) by density-distance graph?
(b) by displacement-distance graph?
What is the nature of sound waves in air?
Complete the following sentence :
Sound is produced by a ___________ body.
An observer A fires a gun and another observer B at a distance 1650 m away from A hears its sound. If the speed of sound is 330 m s-1, find the time when B will hear the sound after firing by A.
What is sound? What causes it to produce?
The sound of which of the following frequency is audible to us?
2 Hz, 1000 Hz, 200 kHz, 8 MHz
Sound is a ______ wave and needs a material medium to travel.
Suppose that a sound wave and a light wave have the same frequency, then which one has a longer wavelength?
Which of the following statements are correct?
- Sound is produced by vibrations.
- Sound requires a medium for propagation.
- Light and sound both require a medium for propagation.
- Sound travels slower than light.
