Advertisements
Advertisements
Question
Draw Average Variable Cost, Average Total Cost ad Marginal Cost curves in a single diagram.
Advertisements
Solution
Average Variable Cost (AVC), Average Total Cost (ATC) and Marginal Cost (MC) curves:
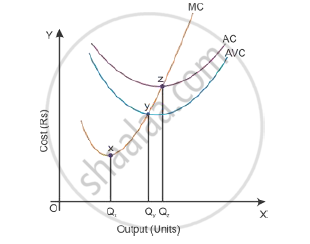
Relationship between ATC (or AC) and MC:
- When ATC is falling, MC falls at a faster rate; and MC remains below ATC curve.
- When AC is rising, MC rises at a faster rate; and MC remains above ATC curve.
- When AC is at its minimum point, (z), MC is equal to ATC.
- MC curve cuts ATC curve at its minimum point.
- ATC and MC are both U-shaped curve reflecting the Law of Variable Proportions.
- While ATC includes both variable as well as fixed cost, whereas, MC includes only the variable cost.
- ATC (or AC) and MC are both derived from TC as:
i.e., `"AC" = ("TC")/("Q") and "MC" = (Delta "TC")/(Delta "Q")`
APPEARS IN
RELATED QUESTIONS
What is the relation between marginal cost and average variable cost when marginal cost is rising and average variable cost is falling?
What is the relation between Average Variable Cost and Average Total Cost, if Total Fixed Cost is zero?
What happens to the difference between Average Total Cost and Average Variable Cost as production is increased?
State the relation between MC curve and AVC and ATC curves.
The cost function of a firm is given below:
| Output | 0 | 1 | 2 | 3 | 4 |
| Total cost | 100 | 250 | 370 | 550 | 740 |
Calculate:
- AFC
- AVC
- MC
Answer the following question.
Explain the relation between the Average Variable Cost (AVC) curve and the Marginal Cost (MC) curve. Use diagram
Explain whether the statement is true or false with reasons.
Total cost curve and Total variable cost curve are parallel to each other.
What is meant by the break-even point?
Draw a well-labelled diagram to show the break-even point.
