Advertisements
Advertisements
Questions
Draw a labelled graph showing the variation in intensity of diffracted light with diffracting angle in a single slit Fraunhofer diffraction experiment.
Draw a labelled graph of intensity of diffracted light (I) versus angle (θ) in the Fraunhofer diffraction experiment for a single slit diffraction.
Graph
Advertisements
Solution
Intensity distribution for Fraunhofer diffraction at a single slit.
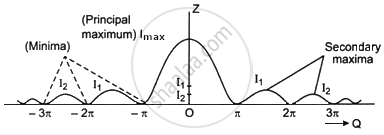
Imax >> I1 > I2 > I3
shaalaa.com
Is there an error in this question or solution?
