Advertisements
Advertisements
Question
Draw a Histogram for the following distribution which gives the marks obtained by 164 students in a particular class and hence find the Mode.
| Marks | 30 – 40 | 40 – 50 | 50 – 60 | 60 – 70 | 70 – 80 |
| Number of Students | 10 | 26 | 40 | 54 | 34 |
Graph
Advertisements
Solution
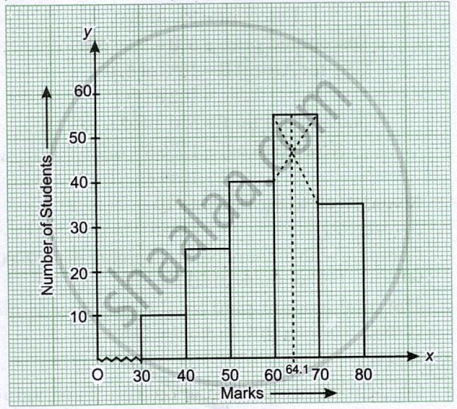
Here model class is 60-70
∴ From the histogram
Mode = 64.1.
shaalaa.com
Is there an error in this question or solution?
