Advertisements
Advertisements
Question
Draw a graph showing the species-area relationship. Name the naturalist who studied such a relationship. Write the observation made by him.
Advertisements
Solution
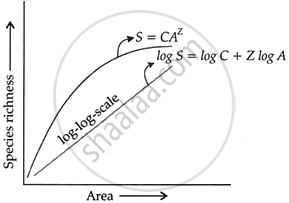
The graph of the species-area relationship shows how the number of species rises as the investigated area increases. Alexander von Humboldt, a naturalist, researched it.
Observations made by Alexander von Humboldt are as follows:
1. Only to a limited extent does species richness rise with the investigated area. The relationship is represented by a rectangular hyperbola, described by the equation: S = CAZ'
Where:
S = Species richness
A = Area
C = Constant
Z = Regression constant
2. Usually, the graph displays a curve that rises sharply initially before leveling out, indicating that expanding the area does not, after a certain point, result in a noticeably higher number of species.
3. Logarithmic scale: The equation log S = log C + Z log A represents the relationship as a straight line on a logarithmic scale.
4. Slope (Z): The value of Z varies depending on the area and taxa studied.
Z typically ranges between 0.1 and 0.2 for small areas. Z can range from 0.6 to 1.2 for larger regions, such as entire continents.
