Advertisements
Advertisements
Question
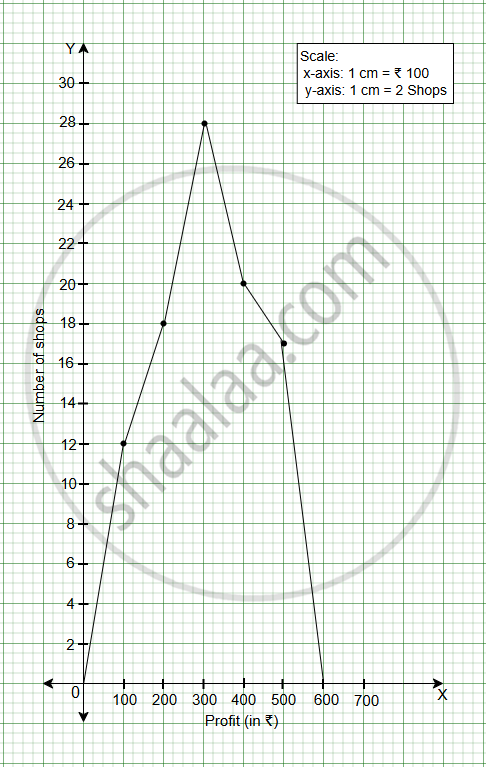
Draw a frequency polygon for the following data:
| Profit (in ₹) | 100 | 200 | 300 | 400 | 500 |
| Number of shops | 12 | 18 | 28 | 20 | 17 |
Graph
Advertisements
Solution
shaalaa.com
Is there an error in this question or solution?
Draw a frequency polygon for the following data:
| Profit (in ₹) | 100 | 200 | 300 | 400 | 500 |
| Number of shops | 12 | 18 | 28 | 20 | 17 |
