Advertisements
Advertisements
Question
Construct a frequency distribution table for the numbers given below, using the class intervals 21-30, 31-40, ... etc.
75, 65, 57, 26, 33, 44, 58, 67, 75, 78, 43, 41, 31, 21, 32, 40, 62, 54, 69, 48, 47, 51, 38, 39, 43, 61, 63, 68, 53, 56, 49, 59, 37, 40, 68, 23, 28, 36 and 47.
Use the table obtained to draw:
- a histrogram
- an ogive
Chart
Graph
Sum
Advertisements
Solution
| Class Interval | Tally | Frequency | c.f. |
| 21 – 30 | |||| | 4 | 4 |
| 31 – 40 | |||| |||| | 9 | 13 |
| 41 – 50 | |||| |||| | 9 | 22 |
| 51 – 60 | |||| || | 7 | 29 |
| 61 – 70 | |||| ||| | 8 | 37 |
| 71 – 80 | ||| | 3 | 40 |

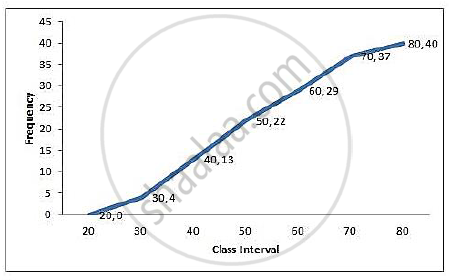
Plot the points (30, 4), (40, 13), (50, 22), (60, 29), (70, 37) and (80, 40) on the graph and join them with free hand to obtain an ogive.
shaalaa.com
Is there an error in this question or solution?
