Advertisements
Advertisements
Question
Conduct a class census by preparing a questionnaire. The questionnaire should contain a minimum of five questions. Questions should relate to students, their family members, their class performance, their health etc. Each student is required to fill up the questionnaire. Compile the information in numerical terms (in terms of percentage). Present the information through a bar, scatter–diagram. (NCERT Geography class IX, Page 60).
Very Long Answer
Advertisements
Solution
- What is your age in years?
- How many members live in your family?
- What was your percentage score in the last exam?
- How many days did you fall sick or miss school this term?
- How many hours do you use mobile/TV daily?
| Compiled Information (Percentage of Students) | Percentage |
| Students having less than 4 family members | 20% |
| Students having 4–6 family members | 60% |
| Students having more than 6 family members | 20% |
| Students studying less than 2 hours daily | 25% |
| Students studying 2–4 hours daily | 55% |
| Students studying more than 4 hours daily | 20% |
| Students with excellent performance | 25% |
| Students with good performance | 60% |
| Students with average performance | 15% |
| Students with good health | 70% |
| Students with average health | 25% |
| Students with poor health | 5% |
| Students participating in sports | 65% |
| Students not participating in sports | 35% |
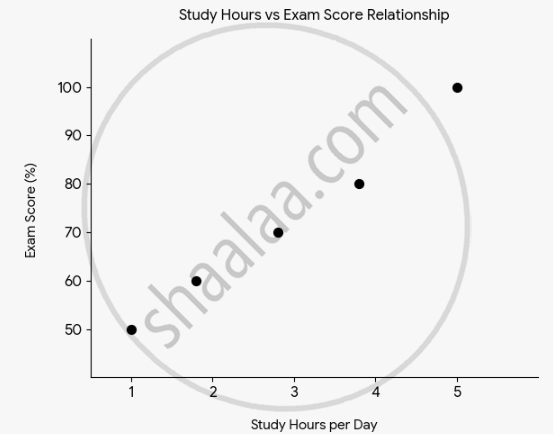
Scatter Diagram:
Title: Relationship between Study Hours and Exam Performance
X-axis: Hours of Study per Day
Y-axis: Percentage Score in Last Exam
| Study Hours (Daily) | Exam Score (%) |
| 1 hour | 50% |
| 2 hours | 60% |
| 3 hours | 75% |
| 4 hours | 85% |
| 5 hours | 95% |
shaalaa.com
Is there an error in this question or solution?
