Advertisements
Advertisements
Question
Complete the following market supply schedule and give a graphical representation of the same.
| Market Supply Schedule of Firm A and B | |||
| Price per unit (₹) | Quantity supplied (kgs) by | Market Supply (kgs) | |
| Firm A | Firm B | ||
| 5 | 3 | 5 | ? |
| 6 | 6 | 9 | ? |
| 7 | 8 | 12 | ? |
| 8 | 9 | 14 | ? |
Chart
Graph
Advertisements
Solution
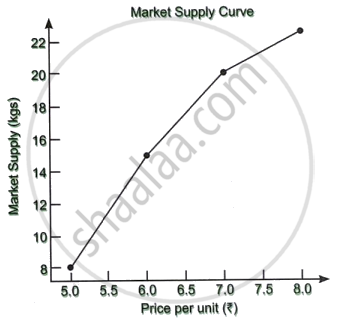
Market Supply = Quantity supplied by Firm A + Quantity supplied by Firm B
| Market Supply Schedule of Firm A and B | |||
| Price per unit (₹) | Quantity supplied (kgs) by | Market Supply (kgs) | |
| Firm A | Firm B | ||
| 5 | 3 | 5 | 3 + 5 = 8 |
| 6 | 6 | 9 | 6 + 9 = 15 |
| 7 | 8 | 12 | 8 + 12 = 20 |
| 8 | 9 | 14 | 9 + 14 = 23 |
shaalaa.com
Is there an error in this question or solution?
