Advertisements
Advertisements
Question
| Class mark | 12.5 | 17.5 | 22.5 | 27.5 | 32.5 | 37.5 | 42.5 |
| Frequency | 12 | 17 | 22 | 27 | 30 | 21 | 16 |
- From the distribution, given above, construct a frequency table.
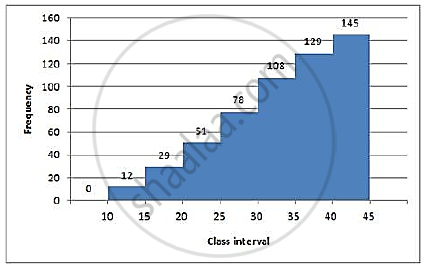
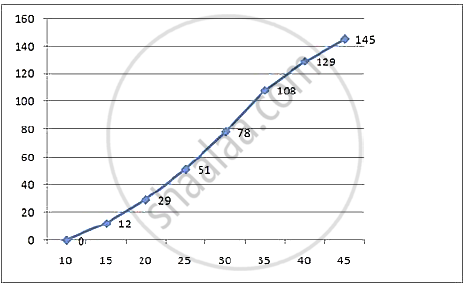
- Use the table obtained in part (a) to draw : (i) a histogram, (ii) an ogive.
Chart
Graph
Sum
Advertisements
Solution
(a) Difference in consecutive class marks = 17.5 − 12.5 = 5
First class interval will be 10 – 15 and so on.
| Class Mark | Class Interval | Frequency | c.f. |
| 12.5 | 10 – 15 | 12 | 12 |
| 17.5 | 15 – 20 | 17 | 29 |
| 22.5 | 20 – 25 | 22 | 51 |
| 27.5 | 25 – 30 | 27 | 78 |
| 32.5 | 30 – 35 | 30 | 108 |
| 37.5 | 35 – 40 | 21 | 129 |
| 42.5 | 40 – 45 | 16 | 145 |
Total = 145
(b) Now plot the points (15, 12), (20, 29), (25, 51), (30, 78), (35, 108), (40, 129), (45, 145) and join them to obtain an ogive.
shaalaa.com
Is there an error in this question or solution?
