Advertisements
Advertisements
Question
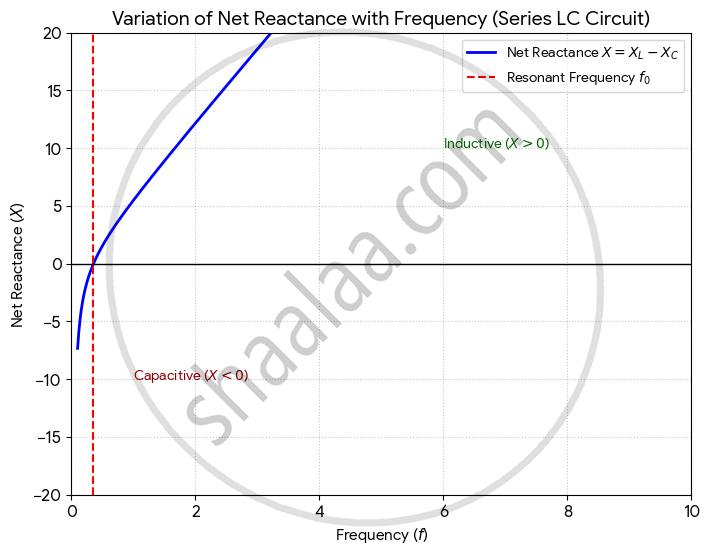
An ideal inductor and an ideal capacitor are connected in series across an ac voltage. Plot a graph showing variation of net reactance of the circuit with frequency of the applied ac voltage.
Advertisements
Solution
In a series circuit containing an ideal inductor (L) and an ideal capacitor (C), the net reactance (X) varies with the frequency (f) of the ac source.
The net reactance is given by the difference between the inductive reactance (XL) and the capacitive reactance (XC).
X = XL − XC
= `2 pi f L - 1/(2 pi f C)`
Capacitive Behavior (f < f0): At low frequencies, XC is larger than XL. The net reactance is negative, indicating the circuit is predominantly capacitive.
Resonance (f = f0): At the resonant frequency, XL = XC, and the net reactance becomes zero. The graph crosses the frequency axis at this point.
f0 = `1/(2pi sqrt(L C))`
Inductive Behavior (f > f0): At high frequencies, XL exceeds XC. The net reactance is positive and increases linearly with frequency as XL dominates.